
Research article/ Open Access
DOI: 10.31488 /bjhd.120
The Relationship Between High-Risk Plaque, Insulin Resistance and Pre-Diabetes in Asymptomatic Men Aged 65-75 With No Diabetes: A DANCAVAS Cross-Sectional Sub-Study
Johanna Larsson* 1, Jess Lambrechtsen2, Søren Auscher2, André Shamoun Jankovic1, Gokulan Pararajasingam1, Laurits Juhl Heinsen1, Thomas Rueskov Andersen1, Jes Sanddal Lindholt3, Axel Cosmus Pyndt Diederichsen4, Kenneth Egstrup1
1. Cardiovascular Research Unit, Odense University Hospital Svendborg, Baagøes Allé 15, 5700 Svendborg, Denmark.
2. Department of Cardiology, Odense University Hospital Svendborg, Baagøes Allé 15, 5700 Svendborg, Denmark
3. Department of Cardiothoracic and Vascular Surgery, Odense University Hospital Odense, J.B. Winsløws Vej 4, 5000 Odense
4. Department of Cardiology, Odense University Hospital Odense, J.B. Winsløws Vej 4, 5000 Odense.
*Corresponding author: Johanna Larsson. Cardiovascular Research Unit, Odense University Hospital Svendborg, Baagøes Allé 15, 5700 Svendborg, Denmark, E-mail: johanna_196@hotmail.com
Abstract
BAim: To evaluate the prevalence of high-risk plaque (HRP) and its association with insulin resistance (IR) and pre-diabetes in asymptomatic men without diabetes or known coronary artery disease (CAD). Method: All participants underwent a contrast-enhanced coronary computed tomography angiography (CCTA) to assess HRP features and necrotic plaque volume (NPV). HRP was defined by the coexistence of positive remodeling (PR) and low-attenuation plaque (LAP) in a plaque. IR was assessed using the homeostatic model assessment for IR (HOMA-IR), and participants were categorized into tertiles. Additionally, participants were categorized into two groups (normal glucose tolerance (NGT) or pre-diabetes) based on a standard oral glucose tolerance test (OGTT). Results: In total, 450 men were enrolled of whom 68 (15%) had HRP. There was no significant difference in prevalence of HRP between participants in the higher HOMA-IR tertile and those in the lower HOMA-IR tertile (16% vs. 13%, overall p = 0.57), nor between participants with pre-diabetes and those with NGT (17%vs. 14%, p = 0.41). Participants with HRP (HRP+) had higher median NPV (43.9 vs. 11.6 mm 3, p <0.001) compared to participants without HRP (HRP-). In the adjusted model, neither IR nor pre-diabetes were associated with HRP, and only NPV remained significantly associated with HRP (OR 1.03 [95% CI 1.02-1.04], p <0.001). Conclusion: In asymptomatic elderly men without diabetes, 15% had HRP. HRP was not associated with HOMA-IR tertiles or pre-diabetes. However, HRP+ was associated with higher NPV, which may indicate increased risk of future adverse coronary events.
Keywords: Asymptomatic, Coronary artery disease, Coronary computed tomography angiography, Insulin resistance, high-risk plaque, Pre-diabetes
Introduction
Cardiovascular disease (CVD) is still one of the leading causes of mortality in Europe [1]. An acute coronary event often occur due to a rupture in a vulnerable plaque and less frequently due to erosion [2]. The rupture may lead to the formation of a thrombus, causing ischemia in the myocardial tissue distal from the lesion, ultimately resulting in acute coronary syndrome (ACS) or sudden cardiac death (SCD) [3, 4]. Identification of a vulnerable plaque has been the subject of numerous studies, where autopsy studies found that precursors to ruptured plaque often consist of a large necrotic core with a thin fibrous cap with macrophage infiltration, often referred to as a thin-cap fibro atheroma (TCFA) [2, 5]. Motoyama et al. [6] were among the first to assess plaque features using coronary computed tomography angiography (CCTA), and reported a > 22% risk of ACS when positive remodeling (PR) and low attenuation plaque (LAP) coexisted in a single plaque, often referred to as “2-features positive” plaques. Additional CCTA studies have reported that not only LAP and PR, but also napkin ring sign (NRS) and spotty calcification (SC), are more prevalent in culprit lesions [7, 8] and are associated with an increased risk of major adverse cardiovascular events (MACE) [9]. Type 2 diabetes mellitus (T2DM) is a major risk factor for coronary artery disease (CAD) [10]. Additionally, insulin resistance (IR) and hyperglycemia in non-diabetic patients increase the risk of CAD [11-13], and glycated hemoglobin A1c (HbA1c) has been associated with HRP in asymptomatic patients with T2DM [14]. To the best of our knowledge, no studies have yet assessed the prevalence of HRP or explored the relationship between HRP, IR, and pre-diabetes in asymptomatic non-diabetic individuals. Therefore, this study aims to explore the prevalence of HRP in asymptomatic men with no diabetes and assess HRP in relation to IR and pre-diabetes.
Methods
Study population
The study population has previously been described [15]. This descriptive, cross-sectional, single-center study was conducted at Odense University Hospital (OUH) Svendborg Hospital, Denmark, from May 2016 to July 2019. All participants were enrolled from the Danish cardiovascular Screening (DANCAVAS) trial, a large population-based multicentre randomized screening trial conducted at five sites in Denmark [16, 17]. Participants enrolled in the DANCAVAS study at OUH Svendborg Hospital and aged 65-75 years were eligible for this study. We excluded participants with an estimated glomerular filtration rate (eGFR) < 45 ml/min, symptoms of CAD (typical angina or New York Heart Association (NYHA) functional classification > II), iodine contrast allergy, untreated hyperthyroidism, active inflammatory disease, or a history of CAD or stroke (Fig.1). Furthermore, we excluded participants who met the diagnostic criteria for diabetes mellitus at the time of inclusion [18]. All examinations performed during this study were performed solely for research purposes.
CCTA
All participants were scanned using the same CCTA scanner (256 detector system GE Revolution CT, GE healthcare, Waukesha, Wisconsin, USA). A prospective ECG-gated acquisition at the 75% of the R-R interval, with addition padding of 45 milliseconds (ms) to allow additional reconstruction was used. Acquisition at the 40% phase of the R-R interval was obtained when needed. To ensure optimal image quality, participants with a heat rate > 60 beats per minute (bpm) were offered ivabradine 7.5 mg twice within 24 hours before the CCTA scan. At the CCTA scanner, intravenous metoprolol was administrated until the heart rate was < 65 bpm. Participants without contraindication to nitroglycerin received sublingual nitroglycerin before the CCTA scan. Sixty mL iodine contrast (Visipaque 320 mg iodine/mL) was administrated manually at maximum attenuation in the ascending aorta. The gantry rotation time was 280 ms with an axial coverage of 16 cm. The tube voltage ranged from 80 to 140 kilovolt, and the current from 140 to 720 milliampere (mA), adjusted according to body mass index (BMI). The slice thickness and interval for reconstruction were both 0.625 mm, and 40% adaptive statistical iterative reconstruction (ASIR) was used. The phase with the best image quality was selected for the final analysis.
CCTA analysis
All CCTA scans were analyzed using the dedicated semi-automatic software system (QangioCT Research Edition v.3.1.3.16, Medic Medical Imaging System, Leiden, the Netherlands) [19]. The program automatically extracted the coronary tree, straitened the coronary arteries, and detected the contours of the inner lumen and outer vessel wall. Theses contours were manually corrected when needed. American Heart association 17 segments model was used for analysis, and in this study, we analyzed the following segments: 1-3, 5-7, 11 and 13 [20]. Segments with a diameter < 1.5 mm were automatically excluded. Segments with insufficient quality for analysis were excluded, and when more than two coronary arteries were non-diagnostic, the participant was excluded. Two observers, JL and ASJ were used to analyzed the scans using an offline workstation.
Coronary plaque evaluation
To estimate plaque burden, we assessed total atheroma volume (TAV), calculated as TAV = vessel volume – lumen volume. When assessing coronary plaques, we defined a plaque as a structure within the vessel wall larger than 1mm3. All plaques in the included segments were identified and characterized as either calcified (> 50% dense calcium), mixed (≤ 50% dense calcium), or non-calcified (0% dense calcium). In the final analysis, we included non-calcified and mixed plaque. Adaptive HU limits were used to assess plaque composition, and four groups of plaque compositions were defined according to previous validation study: necrotic plaque volume (NPV) -30-75, fibrous-fatty plaque volume (FFPV) 76-130, fibrotic plaque volume (FPV) 131-350, and dense calcium plaque volume (DCPV) ≥ 351 [19]. Furthermore, all non-calcified and mixed plaques were evaluated for the presence of the following four high-risk plaque features [21]:
Positive remodeling (PR): A plaque where the outer vessel wall diameter was larger than 10% of the mean diameter of a normal-appearing segment located proximal and distal to the plaque.
Spotty calcification (SC): A small calcification within the plaque no longer than 3 mm and no more than one side of the short-axis view.
Low attenuation plaque (LAP): A plaque with a focal area with lower HU, with at least one voxel with HU < 30.
Napkin ring sign (NRS): A plaque with a ring of higher intensity overlying a central core of low HU.
HRP was considered present when LAP and PR co-existed in one plaque [6]. One observer JL, assessed high-risk plaque features for all the participants.
Insulin resistance, OGTT and blood sample
The validated homeostatic model assessment for IR (HOMA-IR) was used to assess IR, using the calculation: HOMA-IR = [fasting insulin concentration (µIU/ml) * fasting plasma glucose concentration (mmol/L)] / 22.5 [22]. Based on the HOMA-IR, participants were divided into tertiles: lower HOMA-IR tertile (L-IR) (< 1.93), middle HOMA-IR tertile (M-IR) (1.93-3.1), and higher HOMA-IR tertile (H-IR) (>3.1). After a minimum of 10 hours of fasting, glycemic status was assessed using a standard 75-g oral glucose tolerance test (OGTT) according to the World Health Organization (WHO) recommendation [18]. Fasting and two-hour post-load plasma blood glucose were measured, and the participants were classified as: 1) fasting plasma glucose (FPG) of ≥ 7.0 mmol/L for diabetes, ≥ 6.1-6.9 mmol/L for impaired fasting glucose, and < 6.1 mmol/L for normal fasting glucose, 2) Two-hour post-load plasma glucose (2HPG) of ≥ 11.1 mmol/L for diabetes, ≥ 7.8-11.0 mmol/L for impaired glucose tolerance, and < 7.8 mmol/L for normal glucose tolerance. In the following text, NGT refers to normal glucose tolerance and normal fasting glucose, while pre-diabetes refers to either impaired fasting glucose, impaired glucose tolerance, or OGTT within the range for diabetes. Participants with OGTT within the range for diabetes were not excluded from the final analysis, as they did not fully meet the diagnostic criteria for diabetes, since we performed the OGTT only once, and no participants had symptoms of diabetes before, during or after the OGTT. Furthermore, all participants had blood drawn to assess HbA1c, fasting lipid parameters (total cholesterols, low-density lipoprotein (LDL), high-density lipoprotein (HDL), and triglycerides), creatinine, and high-sensitivity C-reactive protein (hs-CRP).
Demography, use of medication and measurements
We collected information on medical use and medical history by reviewing medical records and conducting interviews. Participants were characterized as having hypertension or hypercholesterolemia if they were receiving daily medical treatment with antihypertensive drugs or lipid-lowering agents, respectively. Smoking status was defined as never, former, or active smokers. Smoking exposure was calculated as pack-years (one pack-year = 20 cigarettes (16 gram tobacco) daily for 12 months). Family history of premature CAD was defined according to current guidelines [23]. BMI was calculated as (weight in kg)/height in metres)2. Blood pressure was measured at least twice, after a minimum of 15 minutes rest. Waist was measured horizontally halfway between the most distal costae and the top of the iliac crest, and hip was measured horizontally at the broadest point of the buttock.
Statistics
We reported continuous variables as means and standard deviations (SD) or as medians and interquartile ranges (IQR). Categorical variables were reported as numbers (N) and percentages. For continuous variables with a normal distribution, we used unpaired Student´s t-test to assess differences between two groups, Mann-Whitney test for variables with non-normal distribution, and Fisher´s least significant difference procedure to assess differences between three groups [24]. The Chi-Square test was used to assess differences between categorical variables, and Fisher´s exact test was used when assessing differences between three groups. Logistic regression was used for the analysis of HRP in relation to HOMA-IR tertiles and glycemic groups. Possible confounders were assessed in the multiple regression model and included known risk factors (age, BMI, pack-years, hypertension, and statin use), duration of statin treatment, HbA1c, TAV, hs-CRP, and NPV.
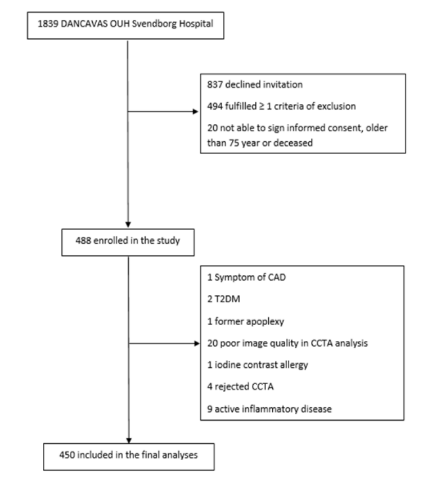
Figure 1:Flowchart of recruitment for study participants.
Flowchart for available participants to the final study population. CAD = coronary artery disease; T2DM = type
2 diabetes mellitus; CCTA = coronary computed tomography angiography
STATA IC 17 was used for all statistical analysis, with a two-sided p < 0.05 considered statistically significant.
Ethics
This study was conducted in accordance with the revised Helsinki Declaration regarding ethical principles for medical research involving human subjects. All participants received both written and oral information before informed consent was signed. The Regional Committee on Health Research Ethics for Southern Denmark, project ID (S-20160024) and the Danish Data Protection Agency, project ID (16/6574) both approved this study. The trial was registered at ClinicalTrial.gov project ID NCT04525508. Research Electronic Data Capture (REDCAP) was used for secure data storage.
Results
Demography, blood sample, and measurements according to HRP status
As previously reported, this study included 450 participants, of whom 373 (83 %) had at least one non-calcified or mixed coronary plaque [15]. A total of 68 (15%) participants had at least one HRP. Table 1 shows the demography, blood sample, and measurements according to HRP-status. Overall, there were only few differences between the groups. Participants without HRP (HRP-) had a significantly lower proportion of participants using aspirin (32% vs. 47%, p = 0.015), but a longer median duration of statin treatment (17 IQR [2; 57] vs. 4 IQR [2.5; 24] months, p = 0.047) compared to participants with HRP (HRP+). HbA1c was higher in HRP+ participants compared to HRP- participants (37.6 ± 3.2 vs. 36.8 ± 3.6 mmol/mol), although this difference was not statistically significant (p = 0.06). There were no significant differences in cardiovascular risk factors such as hypertension, hypercholesterolemia, LDL, BMI, and smoking exposure between the two groups. Additionally, segments length did not differ significantly between the groups (p = 0.11). Demography, blood sample, and measurements according to HOMA-IR tertile and glycemic groups are displayed in Supplementary table 1 and 2, respectively. Furthermore, demography, blood sample, and measurements according to HOMA-IR tertiles and glycemic groups for the 373 participants with at least one coronary plaque are displayed in Supplementary table 3 and 4.
Table 1. Demography, blood sample and measurements in 450 participants.
| All (n = 450) | HRP- (n = 382) | HRP+ (n = 68) | p-value | |
|---|---|---|---|---|
| Age, years | 70 ± 3 | 70 ± 3 | 70 ± 3 | 0.50 |
| Hypertension, n (%) | 163 (36) | 134 (35) | 29 (43) | 0.27 |
| Hypercholesterolemia, n (%) | 186 (41) | 153 (40) | 33 (49) | 0.23 |
| Smoking | > 0.05 | |||
| Active | 46 (10) | 38 (10) | 8 (12) | |
| Previous | 235 (52) | 201 (53) | 34 (50) | |
| Never | 165 (37) | 139 (36) | 26 (38) | |
| Pack-years | 16.5 ± 19.2 | 15.6 ± 18.0 | 22.0 ± 24.9 | 0.14 |
| Familiar disposition, n (%) | 40 (9) | 34 (9) | 6 (9) | 0.98 |
| Aspirin, n (%) | 154 (34) | 122 (32) | 32 (47) | 0.015 |
| ACEIs/ARBs, n (%) | 128 (28) | 106 (28) | 22 (32) | 0.44 |
| Beta-blocker, n (%) | 30 (7) | 27 (7) | 3 (4) | 0.42 |
| Statins, n (%) | 184 (41) | 152 (40) | 32 (47) | 0.26 |
| Duration Statin treatment, months, median [IQR] | 7 [2; 50] | 17 [2; 57] | 4 [2.5; 24] | 0.047 |
| Systolic BP, mmHg | 138 ± 17 | 138 ± 17 | 140 ± 17 | 0.40 |
| Diastolic BP, mmHg | 80 ± 10 | 80 ± 10 | 82 ± 9 | 0.20 |
| Weight, kg | 86 ± 1 | 86 ± 1 | 87 ± 1.5 | 0.53 |
| BMI, kg/m² | 27 ± 4 | 27 ± 3 | 28 ± 4 | 0.32 |
| Waist circumference, cm | 99 ± 11 | 99 ± 11 | 100 ± 11 | 0.62 |
| Hip, cm | 103 ± 7 | 103 ± 6 | 104 ± 7 | 0.62 |
| Waist-hip ratio | 0.96 ± 0.003 | 0.96 ± 0.004 | 0.96 ± 0.008 | 0.73 |
| HbA1c, mmol/mol | 36.9 ± 3.5 | 36.8 ± 3.6 | 37.6 ± 3.2 | 0.06 |
| HDL, mmol/L | 1.6 ± 0.4 | 1.6 ± 0.4 | 1.5 ± 0.4 | 0.09 |
| LDL, mmol/L | 2.6 ± 1.0 | 2.6 ± 1.0 | 2.6 ± 1.1 | 0.95 |
| Total cholesterol, mmol/L | 4.7 ± 1.1 | 4.7 ± 1.1 | 4.7 ± 1.2 | 0.71 |
| Triglycerides, mmol/L | 1.1 ± 0.5 | 1.1 ± 0.5 | 1.1 ± 0.6 | 0.33 |
| Prediabetes, n (%) | 211 (53) | 176 (46) | 35 (51) | 0.43 |
| HOMA 1, median [IQR] | 2.4 [1.7; 3.7] | 2.4 [1.6; 3.6] | 2.7 [1.8; 4.4] | 0.21 |
| FPG, mmol/L | 5.9 ± 0.6 | 5.9 ± 0.6 | 6.0 ± 0.7 | 0.19 |
| 2HPG, mmol/L | 7.1 ± 2.2 | 7.1 ± 2.1 | 7.2 ± 2.5 | 0.79 |
| hs-CRP, mg/L | 2.2 ± 2.9 | 2.2 ± 2.9 | 2.4 ± 3.1 | 0.23 |
| Segment length (mm) | 262.9 ± 55.5 | 260.5 ± 54.4 | 276.3 ± 59.6 | 0.11 |
Continuous values are presented as mean ± standard deviation (SD) or median and [inter quartile range], and
categorical data as prevalence and percentage (%).
BMI = body mass index; ACEI = Angiotensin-converting enzyme inhibitors; ARB = Angiotensin receptor
blockers; BP = blood pressure; HbA1c = hemoglobin A 1c; HDL = high-density lipoprotein; LDL = low-density
lipoprotein; HOMA-IR = homeostatic model assessment for IR; FPG = fasting plasma glucose; 2HPG = 2-h
post-load plasma glucose; hs-CRP = high-sensitivity C-reactive protein; HRP- = participants without high-risk
plaque; HRP+ = participants with high-risk plaque
* HOMA-IR available for 448 participants
** HRP+ vs. HRP
Table 2. Plaque burden and composition in 450 participants.
| All (n = 450) | HRP- (n = 382) | HRP+ (n = 68) | p-value | |
|---|---|---|---|---|
| Plaque burden (mm³) – TAV | 942.3 [771.4; 1149.2] | 906.7 [757.6; 1106.4] | 1130.7 [998.8; 1381.9] | < 0.001 |
| Plaque (mm³) | (n = 373) | (n = 305) | (n = 68) | < 0.001 |
| Number of plaque | 3.0 ± 2.5 | 2.8 ± 2.5 | 4.1 ± 2.2 | < 0.001 |
| PV | 282.3 [129.8; 571.4] | 246.3 [110.8; 503.9] | 541.4 [290.6; 760.4] | < 0.001 |
| NPV | 15.6 [4.9; 33.6] | 11.6 [3.8; 22.1] | 43.9 [27.4; 77.5] | < 0.001 |
| DCPV | 55.3 [17.2; 136.5] | 47.9 [15.7; 128.5] | 92.6 [34.7; 207.9] | 0.008 |
| FPV | 163.7 [76.8; 302.8] | 147.4 [65.7; 283.3] | 266.8 [132.0; 400.6] | < 0.001 |
| FFPV | 41.0 [20.2; 76.6] | 34.4 [17.0; 65.8] | 80.7 [49.2; 124.1] | < 0.001 |
Continuous values are presented as mean ± standard derivation or as median and [inter quartile range]. mm3= cubic millimeter; HRP- = participants without high-risk plaque; HRP+ = participants with high-risk plaque; TAV = total atheroma volume; PV = plaque volume; NPV = necrotic plaque volume; DCPV = dense calcium plaque volume; FPV = fibrotic plaque volume; FFPV = fibrous-fatty volume. * HRP+ vs. HRP
Table 3. High-risk plaque features according to HOMA-IR tertiles for 450 participants*
| All (n = 450) | Lower HOMA-IR tertile (n = 150) | Middle HOMA-IR tertile (n = 150) | Higher HOMA-IR tertile (n = 148) | p-value | |
|---|---|---|---|---|---|
| HRP | 68 (15) | 19 (13) | 25 (17) | 24 (16) | 0.57 |
| PR | 278 (62) | 91 (61) | 93 (62) | 92 (62) | 0.96 |
| SC | 236 (52) | 67 (45) | 85 (57) | 83 (56) | 0.06 |
| LAP | 98 (22) | 26 (17) | 34 (23) | 38 (26) | 0.21 |
| NRS | 2 (0.4) | 0 (0) | 1 (0.7) | 1 (0.7) | 0.60 |
Categorical data as prevalence and percentage (%). HRP = high-risk plaque; PR = positive remodeling; SC = spotty calcification; LAP = low attenuation plaque; NRS = napkin ring sign. *HOMA-IR was available in 448 participants ** Overall p-value across the HOMA-IR tertiles
Table 4. High-risk plaque features according to glycemic group in 450 participants.
| Normal Glucose Tolerance (n = 239) | Pre-diabetes (n = 211) | p-value | |
|---|---|---|---|
| HRP | 33 (14) | 35 (17) | 0.41 |
| PR | 149 (62) | 129 (61) | 0.79 |
| SC | 113 (47) | 123 (58) | 0.02 |
| LAP | 50 (21) | 48 (23) | 0.64 |
| NRS | 1 (0.4) | 1 (0.5) | 0.93 |
Categorical data as prevalence and percentage (%). HRP = high-risk plaque; PR = positive remodeling; SC = spotty calcification; LAP = low attenuation plaque; NRS = napkin ring sign. * Pre-diabetes vs. normal glucose tolerance
Plaque burden and composition according to HRP status
In total, 1345 plaques were identified, corresponding to a mean prevalence of 3.0 ± 2.5 plaques per participant (Table 2). Participants with HRP+ had significantly more plaques, higher median TAV, higher median plaque volume (PV), and higher median volumes of the four different plaque compositions when compared to HRP- participants.
High-risk plaque and features according to HOMA-IR tertile
When participants with H-IR were compared participants with L-IR, there was no significant difference in the prevalence of HRP (16% vs. 13%, overall p = 0.57) (Table 3) (Figure 2). Across the HOMA-IR tertile, participants with H-IR had a higher prevalence of SC when compared to participants with L-IR (56% vs. 45%, overall p = 0.06), although this was not statistically significant. Neither LAP, PR, nor NRS differed significantly between the groups.
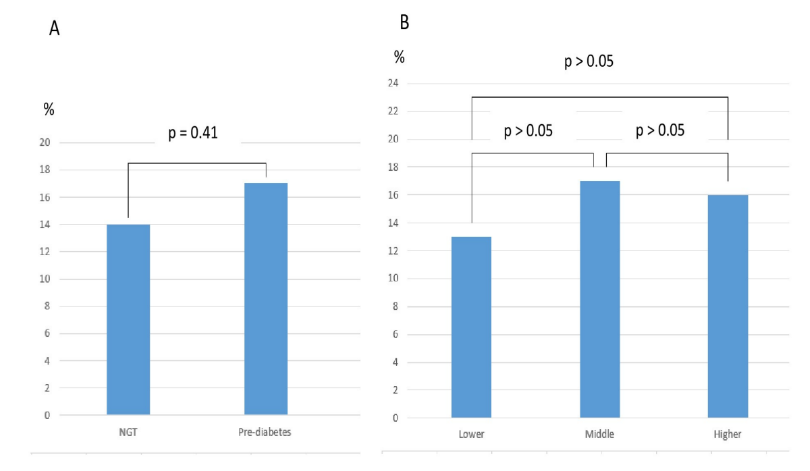
Figure 2:HRP prevalence according to HOMA-IR tertile and glycemic group in 450 participants*
High-risk plaque and features according to glycemic status
The prevalence of HRP did not differ significantly between participants with pre-diabetes and participants with NGT (17% vs. 14%, p = 0.41) (Table 4) (Figure 2). Participants with pre-diabetes had a significantly higher prevalence of SC (58% vs. 47 %, p = 0.02) compared to participants with NGT. However, this association did not remain significant in the multivariable regression model (Supplementary table 5). There were no difference in proportion of PR, NRS, or LAP between the groups.
Univariable and multivariable logistic regression models
Neither HOMA-IR tertiles nor pre-diabetes were associated with HRP in univariable models (Table 5). We also tested HOMA-IR, HbA1c, FPG, and 2HPG as continuous values in univariable analysis, but no significant association were found. On the other hand, smoking exposure, TAV, and NPV were associated with HRP in the univariable logistic regression models, but only NPV remained associated with HRP (OR 1.03 [95% CI 1.02-1.04], p < 0.001) in the multivariable logistic regression model.
Table 5. Uni- and multivariable logistic regression models for 450 participants
| HRP (n = 450) | Univariable | Multivariable (n = 372) | ||||
|---|---|---|---|---|---|---|
| OR | 95% CI | p-value | OR | 95% CI | p-value | |
| Pre-diabetes | 1.24 | 0.74–2.08 | 0.41 | |||
| HOMA-IR tertiles | ||||||
| Lower | ref. | |||||
| Middle | 1.38 | 0.72–2.63 | 0.33 | |||
| Higher | 1.33 | 0.70–2.56 | 0.38 | |||
| HOMA-IR | 1.06 | 0.93–1.21 | 0.37 | |||
| HbA1c | 1.07 | 1.00–1.15 | 0.06 | |||
| FPG | 1.35 | 0.90–2.02 | 0.15 | |||
| 2HPG | 1.02 | 0.91–1.15 | 0.73 | |||
| Duration of statin treatment | 1.00 | 0.98–1.00 | 0.09 | |||
| Statin use | 1.35 | 0.80–2.26 | 0.26 | |||
| Hypertension | 1.38 | 0.81–2.32 | 0.23 | |||
| Pack-years | 1.02 | 1.00–1.03 | 0.01 | 1.01 | 0.99–1.02 | 0.30 |
| BMI | 1.04 | 0.97–1.11 | 0.32 | |||
| Age | 1.04 | 0.94–1.14 | 0.50 | |||
| NPV** | 1.04 | 1.03–1.05 | < 0.001 | 1.03 | 1.02–1.04 | < 0.001 |
| TAV | 1.00 | 1.00–1.00 | < 0.001 | 1.00 | 1.00–1.00 | 0.44 |
| hs-CRP | 1.03 | 0.95–1.11 | 0.54 | |||
OR = odds ratio; 95% CI = 95% confidence interval; HRP = high-risk plaque; HOMA-IR = homeostatic model assessment for IR; BMI = body mass index; HbA1c = hemoglobin A 1c; FPG = fasting plasma glucose; 2HPG = 2-h post-load plasma glucose; BMI = body mass index; TAV = total atheroma volume; NPV = necrotic plaque volume; hs-CRP = high-sensitivity C-reactive protein. * HOMA-IR was available in 448 participants **NPV available in 373 participants.
Discussion
To the best of our knowledge, this is the first study to assess the prevalence of HRP and relationship between HRP, IR, and pre-diabetes among asymptomatic elderly men without diabetes. The main results of the present study are as follows: 1) 15 % of the participants had at least one HRP. 2) IR and pre-diabetes were not associated with HRP. 3) In the adjusted logistic regression model, HRP was associated with vulnerable plaque composition.
Motoyama et al. [6] were among the first to assess plaques features in relation to ACS by using CCTA, and reported an increased risk of ACS during follow up when a 2-feature positive plaque was present. Furthermore, previous prospective studies reported a 70% increased risk of MACE with the presence of HRP [25]. In this study, 15% of the participants had at least one HRP, defined as a plaque with both LAP and PR. In comparison, HRP were observed in 15-34% of the patients with stable angina pectoris (SAP) [25, 26] and in 17-37% of asymptomatic patients with T2DM [14, 27]. The results of the present study seem to be comparable to previous findings, despite the different definitions of HRP among three of the four referenced studies. Ferencik et al. [25] defined HRP as presence of either PR, LAP (when mean 30 HU), or NRS in a single plaque, Williams et al. [26] defined HRP as a plaque with LAP or PR, whereas Heinsen et al. [14] defined HRP as the coexistence of two of the four features (LAP, PR, SC or NRS). The prevalence of HRP in this study would have been up to 38% if we had used similar definition as Heinsen et al. [14]. The high proportion of PR and SC contributed to this difference. In comparison, previous studies including symptomatic patients have reported the proportion of PR ranging from 11.7 to 79.9% [28, 29] and SC ranging from 32 to 43% [28, 30]. This significant divergence may be explained by the moderate inter- and intravariability in assessing the four different plaque features [25, 28]. Furthermore, the participant in this study were older compared to those in Williams et al. [26], Ferencik et al. [25], Heinsen et al. [14] and Kamimura et el. [27]. Additionally, the study population in the present study consisted solely of men, where Heinsen et al. [14] reported a higher prevalence HRP in men compared to women. Finally, we found a similar prevalence of HRP compared to Heinsen et al. [14] and Kamimura et al. [27], despite their inclusion asymptomatic patients with T2DM. Patients with T2DM have previously have been reported to have significantly more HRP than non-diabetic individuals [31]. This likely reflects that our study included solely men and older participants compared to referenced studies. Hopefully, future studies using consistent HRP definitions and enhanced CTTA image quality may further clarify HRP prevalence in this population.
Despite the previously reported strong association between HRP and CAD events, the relatively high prevalence of HRP and the low absolute risk of CAD events in those with HRP, have questioned the predictive value of HRP [21]. Ferencik et al. [25] reported that MACE was experienced by 6.4% of the patient with HRP and among the patients who experienced MACE during the follow-up period, 67.2% had no HRP at inclusion. This demonstrates the complexity of atherosclerosis, where we still miss important pieces in the big puzzle. Coronary plaque can rupture/erode without causing ACS, and many obstructive plaque, mainly consisting of large calcification, may represent healed ruptured/eroded plaque [32, 33]. The calcifications seems to be protective against ACS [8], but increases the risk of SAP due to narrowing of the lumen [33]. Further longitudinal studies are needed to evaluate the predicative value of HRP for MACE, considering the relatively high prevalence of HRP and its previously reported low absolute risk of adverse coronary events.
In the present study, both TAV and NPV were predictors of HRP in univariable logistic analysis. This may indicate that participants with HRP had more advanced atherosclerosis. Only NPV remained significantly associated to HRP in multiple regression models, possible because both TAV and NPV represents the extent of CAD. NPV plays an essential role in plaque vulnerability [2, 29, 34, 35]. Virmani et al. [2] reported that the necrotic core area increased from fibroatheromas to TCFA to ruptured plaque, indicating that the size of the necrotic core impacts the stability of the plaque. Additionally, Chan et al. [29] found that increasing necrotic volume (defined as -30-30 HU) or increasing fibro-fatty volume (defined as 30-130 HU) were associated with an increased risk of ACS. The findings of a significant relationship between NPV and HRP in this study may indicate that participants with HRP have more vulnerable plaque composition, thus are in increased risk of adverse coronary events. However, since our definition of HRP included RI and LAP, and thus plaques with significant remodeling and necrotic core, it can be argued that the association is not surprising. Furthermore, critics of HRP would mean that plaque burden (TAV) [36, 37] and NPV [34], rather than HRP, drive the increased risk of coronary event. This study adds a piece to the big puzzle by reporting the prevalence of HRP and its association with NPV in asymptomatic elderly men without diabetes and no prior CAD.
We did not find a significant association between HRP and IR. In comparison, Iguchi et al. [38] assessed symptomatic patients and reported that HOMA-IR >2.5 predicted TCFA in the culprit lesion. Furthermore, Wu et al. [39] included patients with ACS and reported a significant association between increasing HOMA-IR and TCFA in culprit lesion, using OCT. One explanation for the divergence in results could be the use of different imaging modality and different outcome variable, as Iguchi et al. [38] and Wu et al. [39] assessed TCFA using OCT, whereas the present study assessed HRP using CCTA. CCTA does not have the resolution to assess the fibrous cap thickness, but it can assess other features of the TCFA e.g. large plaque volume (PR) and necrotic core (LAP) [21]. These differences make direct comparison difficult, and more CCTA studies are needed to further explore this issue. Furthermore, Wu et al. included patients with T2DM, who have previously been found to have a significantly higher prevalence of TFCA in non-culprit plaque compared to participants without diabetes [40].
Additionally, we did not find a significant association between HRP and pre-diabetes. Previously, Ito et al. [41] studied glucose variability in patients with dysglycemia (T2DM or impaired fasting glucose) with suspected SAP and defined vulnerable plaque as a plaque with PR and a mean density < 30 HU. They found that increased glucose variability was associated with the presence of vulnerable plaque but found no significant association between vulnerable plaque and HbA1c. Moreover, a CCTA study by Tomizawa et al. [42] included individuals without known CAD who were referred for CCTA due to suspicion of CAD and reported no significant difference in the prevalence of HRP between individuals with pre-diabetes and those with NGT, as assessed using HbA1c. Furthermore, an OCT study by De Rosa et al. [43] reported that abnormal glucose metabolism (DM or pre-diabetes) was an independent predictor of TCFA in patients with SAP. The results of Ito et al. [41] and Tomizawa et al. [42] seems to be comparable to the results of this study, whereas some of the differences between De Rosa et al. [43] and the present study may be explained by the use of different imaging modality and the inclusion of patients with manifest T2DM.
IR and pre-diabetes have previously been associated with increased risk of CAD [11-13]. The possible pathophysiological processes by which hyperglycemia and IR may promote atherosclerosis have been reviewed by Bornfeldt et al. [44]. In the early formation of an atherosclerotic lesion, IR appears to induce endothelial dysfunction and increase the expression of endothelial adhesions molecules while hyperglycemia appears to be associated with increased oxidative stress and increased expression of adhesions molecules. In advanced atherosclerotic plaque, IR seems to increase apoptosis of smooth muscle cells (SMC) causing thinning of the fibrous cap, and apoptosis of foam cells leading to increased necrotic core [44], whereas hyperglycemia does not seem to have a prominent role, although an indirect relation cannot be excluded e.g. by hyperglycemic mediated hyperinsulinemia or by other cardiovascular risk factors often seen together with hyperglycemia. However, we found no significant association between HRP and IR or pre-diabetes. In addition previously described differences from published studies, the non-significant relationship may be attributed to the relatively small study population or the inclusion of older participants, where age-related changes in the coronary arteries or a higher prevalence of comorbidities may have diluted a potential association. Given the rapidly increasing number of individuals with pre-diabetes and IR with increased risk of CAD, further research within this area is essential to halt this development.
SC has previously been reported to be more present in culprit lesions [8, 45], although Feutchner et al. [46] reported that NRS and LAP ≤ 60 HU were stronger predictors of MACE compared to SC. SC is thought to mediate plaque vulnerability by increasing the stress on fibrous cap tissue [47]. In this present study, SC was significantly higher among participants with pre-diabetes compared to participants with NGT in unadjusted analysis. However, this did not remain significant in the adjusted model. The moderate reproducibility and the diverging results of SC in relation to ACS warrants additional exploration.
Conclusion
HRP was present in a relatively high proportion of the population consisting of asymptomatic men without known diabetes or previous CAD. HOMA-IR and hyperglycemia were not associated with HRP, whereas NPV was independently associated with HRP, indicating that HRP may represents individuals with a more vulnerable plaque composition compared to individuals without HRP. Larger studies, especially longitudinal studies, are needed to assess the predictive risk of ACS in individuals with HRP.
Limitations
This study has several limitation that needs to be mentioned. First, this single-centre study had a study population consisted solely of men aged 65-75 years, therefore the data may not be applicable to women and younger individuals. A multicenter study including a study population of both genders and wider age interval would have provided higher generalizability. Second, a relative large proportion of the study population received statin and aspirin, which may question their asymptomatic status. However, this is explained by their previous participation in the DANCAVAS study, consistent with the low median duration of statin use among the participants [16]. Third, the cross-sectional design, in contrary to longitudinal studies, unable conclusions regarding causality between independent and dependent variables and therefore longitudinal studies are needed to further bring light over this issue. Fourth, the definition of pre-diabetes may have affected the results. No participants fulfilled the diagnostic criteria of T2DM when entering the study, but we found that 42 participants had an OGTT within the range for diabetes. Initially, this study aimed to have a category consisting of participants with an OGTT within the diabetic limits but the limited number of participants in this group restricted that approach. The combination of pre-diabetes and OGTT within the diabetic limits may have affected the results, although we did not find significant or borderline significant results when comparing pre-diabetes to NGT, which would have been expected. Fifth, we excluded calcified plaque, which may have led to overlooking plaques with HRP. However, this approach was chosen because the blooming effect of extensive calcifications, such as in calcified plaques, can reduce the precision of especially the lumen of the vessel, leading to inaccurate estimation of plaque volume and composition. It also limits the accurate evaluation of HRP features, such as LAP and RI, which were used to define HRP in this study [21, 56]. Finally, assessments of HRP features have some limitations. Imagine noise may have affected the assessment of LAP due to our definition of LAP. Furthermore, the diameter was larger at the proximal segments compared to more distal segments. Since PR was defined as a percentage relative to a normal appearing segment proximal and distal of the lesion, a larger absolute remodeling was needed in the proximal segments compared to the distal segments.
Availability of Data and Materials
The datasets used and/or analyzed during the current study are available from the corresponding author on reasonable request.
Competing Interests
The authors declare that they have no competing interests.
Funding
Funding was provided by public grants/scholarships from Odense University Hospital (OUH) Odense, the Department of Endocrinology OUH Svendborg, and the Cardiovascular Research Unit, OUH Svendborg.
Authors’ Contributions
JL (Johanna Larsson) designed the study, included patients, collected data, analyzed most of the CCTA scans, and interpreted the patient data. ASJ analyzed part of the CCTA scans. GP and LJH helped with data collection. KE, SA and JL (Jess Lambrechtsen) assisted with the study design. JL (Johanna Larsson) wrote the manuscript with support from KE, SA, JL (Jess Lambrechtsen), GP, ASJ, LJH, TRA, JSL, and ACPD. All authors read and approved the final manuscript.
Acknowledgements
The authors are thankful to staff at the Cardiovascular Research Unit at Odense University Hospital Svendborg and to the radiographers at the CCTA scanner at the Department of Radiology at Odense University Hospital Svendborg.
References
1. Timmis A. European Society of Cardiology: cardiovascular disease statistics 2021. Eur Heart J. 2022;43(8):716–799.
2. Virmani R. Pathology of the vulnerable plaque. J Am Coll Cardiol. 2006;47(8 Suppl):C13–C18.
3. Bentzon JF. Mechanisms of plaque formation and rupture. Circ Res. 2014;114(12):1852–1866.
4. Falk E, Shah PK, Fuster V. Coronary plaque disruption. Circulation. 1995;92(3):657–671.
5. Naghavi M. From vulnerable plaque to vulnerable patient: a call for new definitions and risk assessment strategies: Part I. Circulation. 2003;108(14):1664–1672.
6. Motoyama S. Computed tomographic angiography characteristics of atherosclerotic plaques resulting in acute coronary syndrome. J Am Coll Cardiol. 2009;54(1):49–57.
7. Pflederer T. Characterization of culprit lesions in acute coronary syndromes using coronary dual-source CT angiography. Atherosclerosis. 2010;211(2):437–444.
8. Motoyama S. Multislice computed tomographic characteristics of coronary lesions in acute coronary syndromes. J Am Coll Cardiol. 2007;50(4):319–326.
9. Nerlekar N. Computed tomographic coronary angiography-derived plaque characteristics predict major adverse cardiovascular events: a systematic review and meta-analysis. Circ Cardiovasc Imaging. 2018;11(1):e006973.
10. Sarwar N. Diabetes mellitus, fasting blood glucose concentration, and risk of vascular disease. Lancet. 2010;375(9733):2215–2222.
11. Gast KB. Insulin resistance and risk of incident cardiovascular events in adults without diabetes: meta-analysis. PLoS One. 2012;7(12):e52036.
12. Pyörälä M. Hyperinsulinemia predicts coronary heart disease risk in healthy middle-aged men. Circulation. 1998;98(5):398–404.
13. Ford ES, Zhao G, Li C. Pre-diabetes and risk for cardiovascular disease: a systematic review. J Am Coll Cardiol. 2010;55(13):1310–1317.
14. Heinsen LJ. High-risk coronary artery plaque in asymptomatic patients with type 2 diabetes. Cardiovasc Diabetol. 2021;20(1):164.
15. Larsson J. Insulin resistance and high-risk coronary plaque composition in asymptomatic men. Atherosclerosis. 2023;385:117328.
16. Diederichsen AC. The Danish Cardiovascular Screening Trial (DANCAVAS): study protocol. Trials. 2015;16:554.
17. Lindholt JS. Baseline findings of the DANCAVAS trial. Br J Surg. 2019;106(7):862–871.
18. Alberti KG, Zimmet PZ. Definition, diagnosis and classification of diabetes mellitus. Diabet Med. 1998;15(7):539–553.
19. de Graaf MA. Automatic quantification of coronary atherosclerosis with CT angiography. Int J Cardiovasc Imaging. 2013;29(5):1177–1190.
20. Leipsic J. SCCT guidelines for interpretation of coronary CT angiography. J Cardiovasc Comput Tomogr. 2014;8(5):342–358.
21. Shaw LJ. Expert consensus on coronary CT imaging of atherosclerotic plaque. J Cardiovasc Comput Tomogr. 2021;15(2):93–109.
22. Matthews DR. Homeostasis model assessment: insulin resistance and beta-cell function. Diabetologia. 1985;28(7):412–419.
23. Wood D. Prevention of coronary heart disease in clinical practice. Atherosclerosis. 1998;140(2):199–270.
24. Meier U. Power of Fisher's least significant difference procedure. Pharm Stat. 2006;5(4):253–263.
25. Ferencik M. High-risk coronary plaque detection for risk stratification. JAMA Cardiol. 2018;3(2):144–152.
26. Williams MC. Coronary artery plaque characteristics and adverse outcomes. J Am Coll Cardiol. 2019;73(3):291–301.
27. Kamimura M. Role of coronary CT angiography in asymptomatic type 2 diabetes. Int Heart J. 2012;53(1):23–28.
28. Puchner SB. High-risk plaque predicts acute coronary syndromes. J Am Coll Cardiol. 2014;64(7):684–692.
29. Chang HJ. Coronary atherosclerotic precursors of acute coronary syndromes. J Am Coll Cardiol. 2018;71(22):2511–2522.
30. Kitagawa T. Characterization of noncalcified coronary plaques. JACC Cardiovasc Imaging. 2009;2(2):153–160.
31. Xi Y, Xu Y, Shu Z. Impact of hypertension on coronary plaques in type 2 diabetes. Front Artif Intell. 2024;7:1446640.
32. Mann J, Davies MJ. Mechanisms of progression in coronary artery disease. Heart. 1999;82(3):265–268.
33. Burke AP. Healed plaque ruptures and sudden coronary death. Circulation. 2001;103(7):934–940.
34. de Knegt MC. Coronary atherosclerosis morphology by CT. Eur Heart J Cardiovasc Imaging. 2019;20(11):1221–1230.
35. Williams MC. Low-attenuation plaque predicts myocardial infarction. Circulation. 2020;141(18):1452–1462.
36. Shan P. Coronary atheroma burden and cardiovascular events. Am J Cardiol. 2015;116(11):1672–1677.
37. Puri R. Coronary atheroma volume and cardiovascular events. Eur Heart J. 2013;34(41):3182–3190.
38. Iguchi T. Insulin resistance and plaque vulnerability. Eur Heart J Cardiovasc Imaging. 2014;15(3):284–291.
39. Wu S. Insulin resistance and plaque vulnerability in ACS. Angiology. 2019;70(6):539–546.
40. Sugiyama T. Coronary plaque characteristics in diabetes. J Am Heart Assoc. 2018;7(14).
41. Ito T. Glucose variability and plaque vulnerability. J Cardiol. 2021.
42. Tomizawa N. HbA1c and high-risk plaque. Int J Cardiovasc Imaging. 2016;32(3):493–500.
43. De Rosa R. Coronary plaque characteristics and risk factors. Circ J. 2017;81(8):1165–1173.
44. Bornfeldt KE, Tabas I. Insulin resistance and atherosclerosis. Cell Metab. 2011;14(5):575–585.
45. Mizukoshi M. Coronary calcium deposits in ACS. Am J Cardiol. 2013;112(1):34–40.
46. Feuchtner G. Low-attenuation plaque and napkin-ring sign predict MACE. Eur Heart J Cardiovasc Imaging. 2017;18(7):772–779.
47. Barrett HE. Calcifications in atherosclerotic plaques. J Biomech. 2019;87:1–12.
48. Libby P. Atherosclerosis. Nat Rev Dis Primers. 2019;5(1):56.
49. Antonopoulos AS. Biomarkers of vascular inflammation. JACC Cardiovasc Imaging. 2022;15(3):460–471.
50. Conte E. High-risk coronary atherosclerosis and biomarkers. J Cardiovasc Comput Tomogr. 2021;15(1):73–80.
51. Pedersen G. Biomarkers for high-risk coronary plaques. J Cardiovasc Comput Tomogr. 2024;18(5):467–475.
52. Valenzuela PL. Obesity and cardiometabolic disease risk. Nat Rev Cardiol. 2023;20(7):475–494.
53. Afshin A. Health effects of overweight and obesity. N Engl J Med. 2017;377(1):13–27.
54. Fuchs A. Subclinical coronary atherosclerosis and MI risk. Ann Intern Med. 2023;176(4):433–442.
55. McDermott M. SCOT-HEART 2 trial design. JACC Cardiovasc Imaging. 2024;17(9):1101–1112.
56. Pack JD. Cardiac CT blooming artifacts. Vis Comput Ind Biomed Art. 2022;5(1):29.
Received: November 15, 2025;
Accepted: December 18, 2025
Published: December 26, 2025.
To cite this article : Larsson J, Lambrechtsen J, Auscher S, Shamoun Jankovic A, Pararajasingam G, Heinsen LJ, et al. The relationship between high-risk plaque, insulin resistance, and pre-diabetes in asymptomatic men aged 65–75 years without diabetes: a DANCAVAS cross-sectional sub-study. 2025;5(1):200–209. doi:10.31488/bjhd.120.
© The Author(s) 2026. This is an open access article distributed under the terms of the Creative Commons Attribution License (https://creativecommons.org/licenses/by/4.0/).